


Pete Alonso & the crack of the bat
What exit velocity tells us about future performance

The return of baseball brings with it the usual clichés about the pop of the catcher’s mitt and the crack of the bat. We talk about these things to heighten our emotional connection to the game we grew up watching. But they are also sounds we have used to approximate performance, such as the speed of a fastball or the quality of contact on a swing.
In fact, our ears have been trained to listen for the crack of the bat in alerting our eyes to see how hard the ball was hit.
After Major League Baseball installed fancy cameras in every ballpark, baseball observers gained a new way to understand the game through tracking information. This “Statcast data” tells us more precisely what our ears and eyes have always been trying to express.
We now know exactly how hard a ball was hit by measuring its exit velocity, or the speed by which it came off the bat immediately after making contact, which turns out to be more than a descriptive number. Research is starting to show that the distribution of hard hit balls could be predictive of future performance. I wrote about this last week in reference to James McCann’s 90th percentile exit velocity compared to J.T. Realmuto’s.
And there may be an interesting lesson to be learned about Mets slugger Pete Alonso as he enters his third season (more on this in a minute or two).
Mets Fix is a newsletter that publishes every weekday morning at 8:00am with all the latest Mets news, links, and analysis (like this). Sign-up for FREE below:
It doesn’t take a fancy tracking camera to tell us that not all batted balls are the same. All else being equal, a hitter would prefer to hit the ball harder than softer, even though baseball is a funny sport where a slow ground ball can turn into a game-winning hit, while a sharp liner could land right in the opposing fielder’s glove to end the game.
The problem with using “average” exit velocity, as many modern analysts do, is that it doesn’t reflect the distribution of batted balls. For an easy example, a batter who hits two balls at 75 MPH will have the same average exit velocity as a batter who hits one ball at 50 MPH and another at 100 MPH. However, they likely would have had different results. The slugging percentage for balls hit between 75-80 MPH was only .246 last season; whereas, it jumps to 1.064 on balls smashed harder than 95 MPH. You’d rather go 1-2 with a home run than 0-2 with equal soft contact.
It is this logic that explains why focusing on the distribution of batted balls is important in evaluating a hitter and in predicting their future performance. And we can start to do that by looking at hard hit rate, which tells us how often a batter hit the ball faster than 95 MPH.
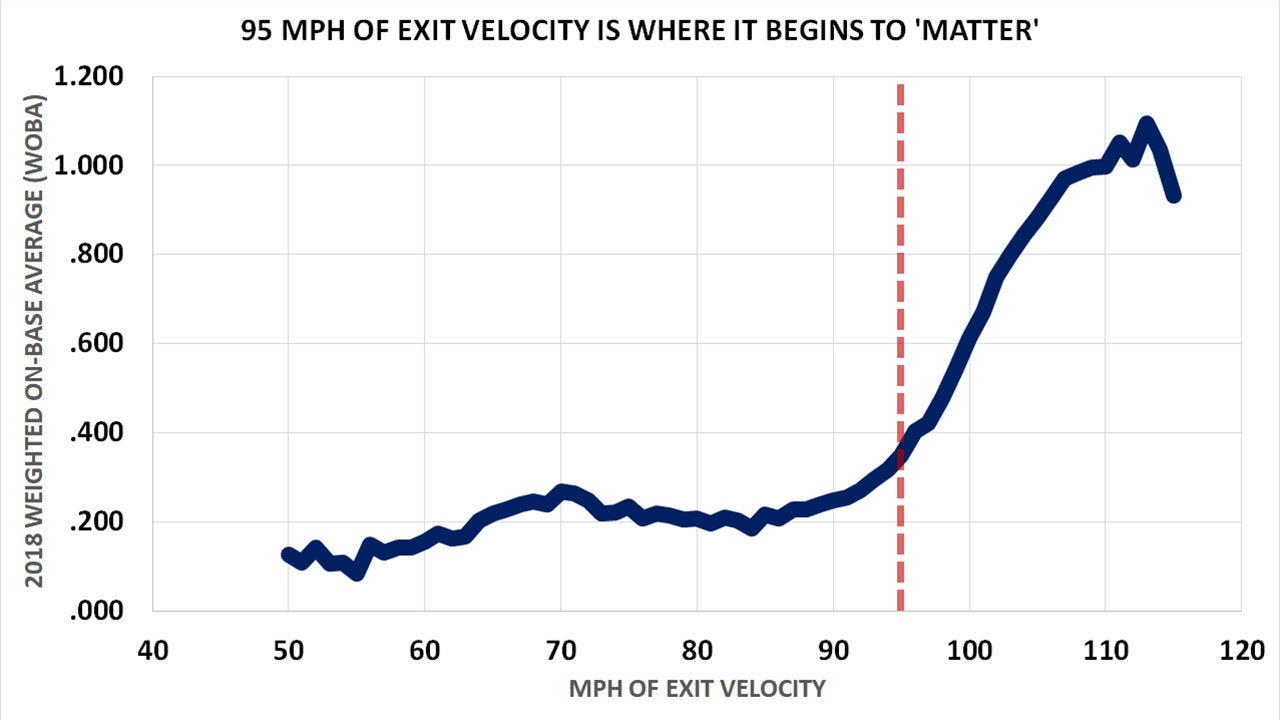
You can see in the graphic above that once you reach that 95 MPH threshold, the corresponding results are significant relative to the difference in hitting the ball at, say, 70 MPH versus 80 MPH. And if we add launch angle into the equation, we can use “barrels” or barrel percentage to find out how often a player not only makes hard contact, but lifts the ball at such an angle that it is most likely to turn into a home run.
A properly tuned model would weigh each batted ball differently based on their individual exit velocities and launch angles to produce a prediction on performance.
What does all of this mean? Research by Jeremy Siegel at Pitcher List shows 90th percentile exit velocity (so the 10% of balls hit the hardest) is more predictive of next-year performance than either average exit velocity or hard hit rate.
Thinking about it logically, we discussed earlier why the average of all batted balls can be misrepresentative of expected results, but even hard hit rate might undervalue the degree to which players make solid contact. The question then becomes which area of the curve to focus on in trying to identify the most meaningful hard hit events. Initially, I looked at the 90th percentile in my analysis of McCann and found his results somewhat similar to Realmuto’s.
But discussing this approach with MLB Advanced Media architect and Statcast guru Tom Tango, he suggested to look at the average of the top 80th percentile, and in doing so, we get a different picture.

As you can see, the two catchers go from having similar results in 2020 (using average exit velocity) to very different results (looking at the average of their most meaningful hard hit balls).
Extending this approach to the rest of the Mets roster, we learn even more.
While this is not fully predictive, it is reasonable to assume that hitters with the greatest margin between their “average” exit velocity and the average of their hardest hit balls have the potential for performing better in the future than a glance at their statistics might suggest.
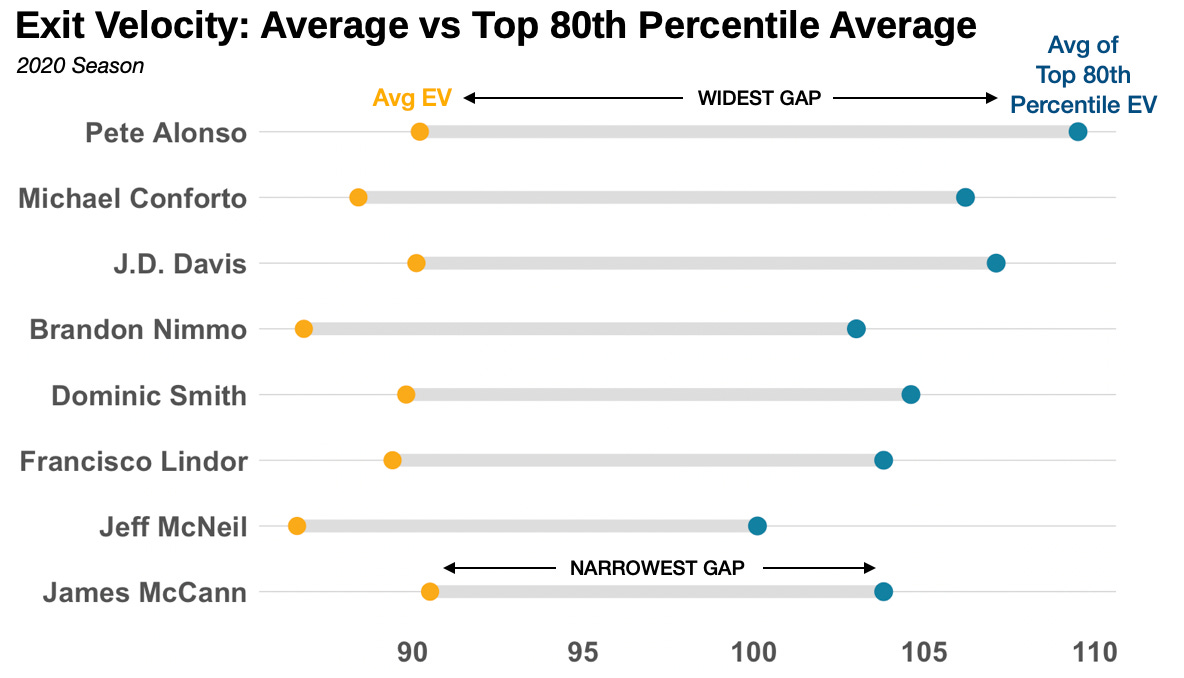
Interestingly, Pete Alonso has the widest such gap on the Mets. He also had the 9th highest 90th percentile exit velocity in baseball last season. This means Alonso’s average exit velocity in 2020 might undervalue his true talent for hitting the ball really hard.
More research needs to be completed, but the fundamental point remains: the harder the ball is hit, the more damage is done, so understanding the profile of batted balls can tell us a lot about an individual hitter.
And as kids with mattress-pressed gloves head to their local diamond to impersonate the players reporting to Spring Training this week, it is fun to think about that familiar sound we all grew up hearing — the crack of the bat — and how it still tells us a lot about the game of baseball; we can just measure it more precisely now.