☀️ Good Morning:
We are one week away from pitchers & catchers reporting, and thank goodness!
The Mets are luckily one of the few teams that is seemingly always at work, keeping their ears to the pavement in free agency and trades, scouring the international market, generating endless buzz to feed our insatiable appetite for our favorite team.
Still… I’m ready for some actual baseball.
This week might be the slowest on the calendar. Perhaps that means the timing is finally right for a conclusion to the Alonso Saga.
One more week and we can at least start talking about backfield practice and pitchers throwing off flat ground. Oh, the things we cherish as baseball fans.
☕️ Grab your coffee for your morning dose of Mets Fix!
📈 Projections
We talked yesterday about PECOTA’s overall team projections. I want to focus today on the individual player projections.
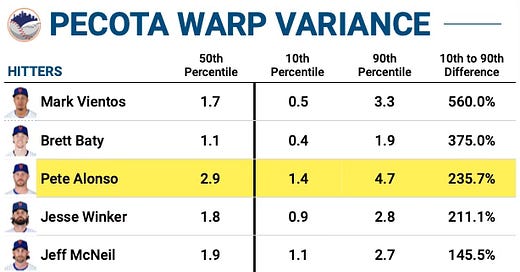
PERCENTILES: Loyal readers of this newsletter understand percentile forecasts, which represent a particular performance outcome at various levels of probability. The numbers we see attached to projection systems, like PECOTA, are often displayed in the 50th percentile. For example, PECOTA shows Mark Vientos with a 50% chance of achieving 1.7 WARP or higher.
Using percentiles, we can get an idea of how confident the model is about different players. We know Juan Soto is going to be really, really good. Over 1,000 simulations, he is projected by PECOTA to produce less than 4.5 WARP only 10% of the time. We can also see which players need a lot of things to go right to have a strong season.
NOTE: It’s a little confusing to read the WARP values in the tables below — the 10th percentile represents the minimum value the player will reach at least 90% of the time, and the 90th percentile value represents the minimum value they will reach at least 10% of the time.
Keep reading with a 7-day free trial
Subscribe to Mets Fix to keep reading this post and get 7 days of free access to the full post archives.


